
A/B Testing
Socrates: What is A/B testing?
Me: A/B testing is a way to check if a change actually makes a
difference by running an experiment with two or more groups.
Example 1: A company wants to know if a new website design will get more clicks. They show half the users the old design and the other half the new one. If more people click on the new design, it’s likely better.
Example 2: A candy company wants to see if people like a slightly sweeter version of their product. They let one group try the original and another group try the sweeter version. If more people prefer the sweeter one, they might change the recipe.
Socrates: But what is a change?
Me: A change can be anything you want to test. It could be a new
design, a different price, a tweak in wording, or maybe a slight
adjustment to a recipe. The goal here is to see if this change makes a
real difference from a statistical point of view — something we call
statistical significance.
Socrates: So, how do we know if there’s really a difference?
Me: We run the experiment, collect data from the two groups, and
then compare the results. The question is: does the new version perform
better than the original? Or are the differences we see just due to
chance? That’s where statistics (AB Test) help us understand if the
change actually matters.
Socrates: What is a hypothesis?
Me: A hypothesis is a clear statement about what we expect to happen
when we introduce a change.
Socrates: So, you’re saying a hypothesis is just a guess?
Me: Not exactly. A hypothesis is more than just a guess — it’s an
educated assumption based on logic, prior knowledge, or past data.
It must be testable and clearly state the expected outcome.
testing. It helps the team focus on a specific question, making it
easier to interpret the results.
Example: Suppose an e-commerce platform wants to test a new layout for the product detail page. The team’s hypothesis could be:
“If we use a simplified layout with fewer distractions and a more prominent ‘Buy Now’ button, then conversion rates will increase because customers can focus more on the primary call-to-action.”
This statement clarifies what change is being tested, what outcome is expected, and why.
Socrates: Can a hypothesis be wrong?
Me: Absolutely! A hypothesis is not about being right or wrong;
it’s about learning. Even if the test shows no improvement or a negative
effect, that’s still valuable information. A failed hypothesis helps us
understand what doesn’t work and refine future tests.
Socrates: So, a failed A/B test isn’t a waste of time?
Me: Not at all! A failed test helps us avoid bad decisions. It’s
better to learn that a change doesn’t work before rolling it out to
everyone. That’s why a good hypothesis isn’t just about getting a
positive result — it’s about testing ideas with clear expectations
and learning from the data.
Measuring Success: The Role of Metrics
Socrates: Wait, wait, wait! What should we even measure? What if
we can’t measure what we actually care about?
And what if the test shows that my new button is amazing — tons of
people are clicking it — but… it’s actually making things worse?
Example: imagine we test a new “Buy Now” button that’s bigger and more colorful. The test results show a huge increase in clicks! Success, right?
But then we check customer support tickets — suddenly, a lot more people are calling to ask how to cancel accidental purchases. The button was so big and eye-catching that users clicked it without meaning to buy!
Me: Exactly! That’s why we need guardrail metrics — to make sure a test doesn’t just look good on the surface while secretly making things worse or hurting other metrics (Things we care about).
Success Metrics (Primary Metrics)
Socrates: What are success metrics?
Me: Success metrics (or primary metrics) are the key numbers we
use to measure whether a test had the intended effect.
Example:
If an e-commerce site tests a new checkout process, the primary success metric could be conversion rate — the percentage of visitors who complete a purchase.
Socrates: Can we just track one metric and call it a day?
Me: Not really. Relying on a single metric can be risky because it
doesn’t tell the whole story. That’s why we also use guardrail
metrics to make sure we’re not causing unintended harm.
Socrates: What happens if a test improves the success metric but
hurts a guardrail metric?
Me: Then we have to reconsider the change. If conversion rates go
up but customer satisfaction drops, the test might not be worth
implementing. That’s why guardrails help prevent bad business
decisions.
Proxy Metrics
Socrates: What if we can’t directly measure what we want?
Me: That’s where proxy metrics come in. A proxy metric is
something easier to measure that closely relates to the real goal.
Example:
If we want to test if a new product page design increases sales, but we can’t track purchases in real-time, we might use “Add to Cart” clicks as a proxy metric.
If an education platform wants to measure student engagement, but tracking long-term learning is hard, a proxy metric could be time spent on lessons or quiz completion rates.
Socrates: But how do we know if a proxy metric really reflects what
we care about?
Me: We need to validate it first — by checking past data to
see if it correlates well with the real outcome. If “Add to Cart”
clicks don’t usually lead to purchases, then it’s a weak proxy.
Variants and Randomization
Socrates: Alright, so we know how to measure success and avoid bad
decisions. But tell me, why do we even need two groups? Can’t we just
change something and see what happens?
Me: If we don’t compare against a control group, we won’t know
if the change actually made a difference or if something else caused it.
Maybe sales increased because it was holiday season, not because of
the new button.
Socrates: So, what exactly are these groups?
Me: Every A/B test has at least two variants:
- Control Variant - The original, unchanged version.
- Test Variant - The version with the change we are testing.
Example:
If we’re testing a new homepage layout, the control group sees the old homepage, and the test group sees the new layout. If the test group engages more, the change is likely working.
Why Randomization Matters
Socrates: But how do we decide who sees which version?
Me: We randomly assign users to either the control or test
group.
Socrates: Why random? Can’t we just test the new version on people
who visit in the morning and the old one on those who visit at night?
Me: That’s risky! What if people who shop in the morning behave
differently from those at night? Then the difference wouldn’t be because
of the new design — it would be because of user behavior.
Socrates: So, randomization makes sure the groups are similar?
Me: Exactly! Random assignment ensures that the groups are
statistically similar, so any differences we see in the results are
likely due to the change itself — not external factors.
Ensuring a Reliable Test: Sample Size & Statistical Power
Socrates: Alright, so we have a test group, a control group, and we
randomize them. But… how many people do we actually need in this
experiment? Can’t we just test on, say, 20 people and see what happens?
Me: Not quite. If our sample size is too small, we might miss
real effects or mistake random noise for meaningful changes.
Example:
Imagine flipping a coin 5 times — it might land on heads 4 times, making it seem like the coin is biased. But if you flip it 1,000 times, you’ll see it’s actually balanced. The same logic applies to A/B testing — small samples can be misleading.
What is Statistical Power?
Socrates: So, how do we make sure our test is reliable?
Me: We need statistical power — the ability of a test to
detect a real effect when one exists.
Socrates: And what does that mean in practice?
Me: It means we need enough people in our test to confidently
say whether the change works or not. If we don’t have enough data, we
might fail to detect a real improvement.
Example:
Suppose we test a new “Subscribe Now” button and see a 2% increase in sign-ups. If we only tested on 100 people, that 2% could be random. But if we tested on 100,000 people, we’d be more confident that it’s a real improvement.
What is the Minimum Detectable Effect (MDE)?
Socrates: But how do we decide how many people are “enough”?
Me: That depends on how big of a change we want to detect — this
is called the Minimum Detectable Effect (MDE).
Socrates: What does that mean?
Me: MDE is the smallest improvement we care about detecting. The
smaller the effect we want to detect, the more people we need in our
test.
Example: If we only care about big changes (e.g., a 20% increase in clicks), we don’t need a huge sample.
But if we want to detect tiny improvements (e.g., a 1% increase), we need a much larger sample to be sure it’s not random.
Now that we have a hypothesis, we’ve set our metrics, and we have historical data, it’s time to answer a crucial question: How many users do we actually need in the test?
A Practical example
Anna (Product Manager): “We’re ready to launch the test! How many users do we need?”* Bishi (Senior Data Scientist): *“We need to calculate that. First, let’s look at how many users typically complete a purchase.”
Bishi pulled data from the past 30 days:
- Total visitors per day: 200,000
- Checkout conversion rate: 5% (5% of users actually buy)
- Completed purchases per day: 10,000
Bishi: “What’s the smallest improvement we care about?”* Anna: *“Even a 1% increase in checkouts would be a win.”
Bishi needed three things:
✅ Baseline conversion rate (5%)
✅ Minimum Detectable Effect (1%)
✅ Statistical power (80%) (Nothing special, just a rule of thumb)
He ran the calculation in Python:
from statsmodels.stats.power import NormalIndPower
power_analysis = NormalIndPower()
sample_size_per_group = power_analysis.solve_power(effect_size=0.01 / 0.05, alpha=0.05, power=0.8)
total_sample_size = sample_size_per_group * 2
print(f"Total required sample size: {int(total_sample_size)}")
The result? 100,000 users total (50,000 per group).
Anna: “Can we get this sample size quickly?”
Bishi: “Yes. We have 200,000 daily visitors, so we’ll get enough
users in just one day. But we should run the test for at least a week to
cover daily traffic patterns.”
Understanding Statistical Significance and Effect Size
Socrates: Alright, we’ve got our test running with the right sample
size. But how do we know if the results actually mean something?
Me: Now we introduce the null hypothesis and the alternative
hypothesis.
Socrates: The null… what now?
Me: Don’t worry, it’s simple. Think of it like this:
- The null hypothesis (H₀) assumes nothing changed — that our new version has no real effect compared to the old one.
- The alternative hypothesis (H₁) is what we hope is true — it says that the new version actually makes a difference. Socrates: So in our checkout button test, the null hypothesis would be…?
Me: “The new checkout button does NOT improve conversions.” And the alternative hypothesis would be: “The new checkout button increases conversions.”
Socrates: And our test is just trying to see if we have enough proof
to reject the null hypothesis?
Me: Exactly! If we reject the null, we can say the new version
likely had an effect. But if we fail to reject it, we can’t
confidently say the change made a difference.
Socrates: So, if our test shows an increase in conversions, that
means our change worked?
Me: Not necessarily! Even if the test looks good, we need to
check whether the difference is statistically significant.
Example:
If we test a new checkout page and conversion rate increases from 5% to 5.2%, that might seem good. But if this change is not statistically significant, it could just be luck.
The Role of the p-value
Socrates: How do we check if a result is significant?
Me: We use the p-value — it tells us how likely it is that the
result happened by chance.
- A low p-value (e.g., < 0.05) means the change is unlikely to be random, so we reject the null hypothesis and say the test likely had an impact.
- A high p-value (e.g., > 0.05) means we don’t have enough evidence to say the change made a difference.
Example:
If your p-value is 0.03, there’s only a 3% chance that the results happened randomly, meaning the new version likely had a real effect.
Socrates: Hold on. You keep saying we reject the null hypothesis if
the p-value is less than 0.05. But… why 0.05? Why not 0.06? Or
0.01?
Me: Good question! The 0.05 threshold is not a law of nature
— it’s just a convention that statisticians have agreed upon over
time.
Socrates: So, it’s an arbitrary number?
Me: Kind of. But it strikes a balance between avoiding false
positives and false negatives.
- If we set α = 0.06, we’d be slightly more lenient, meaning we’d reject the null hypothesis more often — but that increases the chance of false positives (thinking something works when it doesn’t).
- If we set α = 0.01, we’d be very strict, meaning we’d only accept results with very strong evidence — but that increases the chance of false negatives (missing real effects).
Statistical Significance vs. Practical Significance
Socrates: So, if my p-value is low, I should roll out the change immediately?Me: Not so fast! Statistical significance doesn’t mean the change is important.
Example:
If a test shows a 0.1% increase in conversions, the p-value might say it’s significant, but if that tiny change doesn’t cover development costs, it’s not practically significant.
Socrates: So, how do I know if a result is truly useful?
Me: That’s where effect size comes in — it tells us how big
the impact is, not just whether it exists.
Understanding Effect Size
Socrates: What exactly is effect size?
Me: Effect size quantifies how meaningful a difference is
between the test and control groups, typically the difference between
a sample value and a null value. For example, the mean difference
between a treatment group and a control group
Example:** A **12% revenue increase from a small change in ad wording — big effect!
A tiny 0.1% increase in conversions that costs millions to implement — not worth it.
Socrates: So, statistical significance tells me if a change is real,
and effect size tells me if it’s worth it?
Me: Exactly!
Socrates: This all sounds precise. But do people ever misinterpret results?Me: All the time! Here are some common mistakes:
Avoiding Common Mistakes
🔴 Thinking non-significant results mean “no effect.”
✅ A test might just be underpowered or need a larger sample
size to detect an effect.
🔴 Misunderstanding the p-value.
✅ A p-value of 0.05 doesn’t mean there’s only a 5% chance
you’re wrong. It just means that if the null hypothesis were true,
you’d see results this extreme 5% of the time by chance.
🔴 Thinking statistical significance means practical significance.
✅ Just because a result is statistically significant doesn’t mean
it’s meaningful or useful in the real world.
Example:
Imagine an A/B test on an e-commerce site where a new product page increases conversions from 2.00% to 2.5%. The result is statistically significant (p-value < 0.05), but in reality, a 0.5% increase is too small to justify the cost of redesigning the page across the entire website. The effect is real, but it’s not worth acting on.
Practical Example
Socrates: Alright, we’ve talked about statistical significance, but
how do we actually test it?
Me: Let’s say a company is testing a sweeter version of its
product to see if more people like it.
Socrates: How do we check if the sweeter version actually makes a
difference?
Me: We collect data! Here’s how it looks:
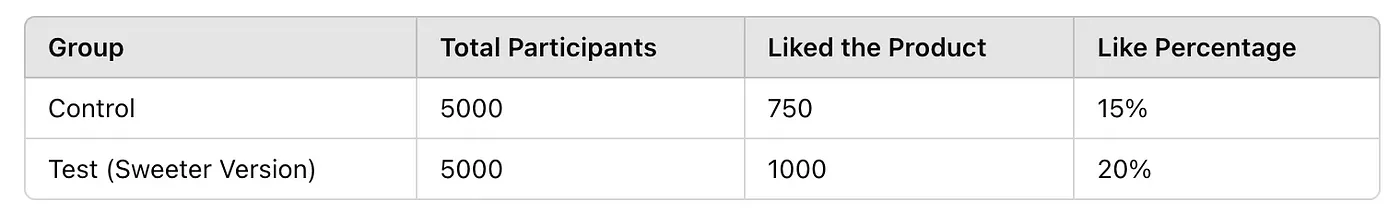
Socrates: Hmm… I see that more people liked the sweeter version,
but how do we know if that’s just random chance?
Me: That’s where we run a statistical test. In this case, we use
a Z-test for proportions, which checks if the increase from 15% to
20% is real or just noise.
Socrates: And what did the test say?
Me: We got a p-value < 0.001, which is way below 0.05 —
meaning the difference is statistically significant.
Socrates: So the sweeter version is better? Case closed?
Me: Not so fast! We also need to check the effect size to see if
this change is actually meaningful.
Socrates: How do we measure that?
Me: We calculate Cohen’s h, which tells us how big the
difference is. In this case, we found an effect size of 0.125 —
which is small, but meaningful, maybe not, it depends.
Socrates: So, statistical significance tells us the change is real,
and effect size tells us if it’s important?
Me: Exactly! If the effect size were 0.01, even a significant
p-value wouldn’t mean much. But since 0.125 is noticeable, this
change might be worth rolling out.
Here is an example python code for the Test.
import pandas as pd
import numpy as np
from statsmodels.stats.proportion import proportions_ztest

# Simulated A/B test data
np.random.seed(42)

data = {
    "Group": ["Control"] * 5000 + ["Test"] * 5000,
    "Liked": np.concatenate([
        np.random.choice([0, 1], size=5000, p=[0.85, 0.15]),  # 15% liked in Control
        np.random.choice([0, 1], size=5000, p=[0.80, 0.20])  # 20% liked in Test (sweeter version)
    ])
}

df = pd.DataFrame(data)

# Aggregating data
like_counts = df.groupby("Group")["Liked"].sum().values
sample_sizes = df.groupby("Group")["Liked"].count().values

# Running a Z-test
stat, p_value = proportions_ztest(like_counts, sample_sizes, alternative='larger')

# Calculating effect size (Cohen's h)
control_rate = like_counts[0] / sample_sizes[0]
test_rate = like_counts[1] / sample_sizes[1]
effect_size = 2 * (np.arcsin(np.sqrt(test_rate)) - np.arcsin(np.sqrt(control_rate)))

# Display results
print(f"Z-test Statistic: {stat:.2f}")
print(f"P-value: {p_value:.5f}")
print(f"Effect Size (Cohen's h): {effect_size:.3f}")
I will also publish a new article that covers A/B testing in a more rigorous and in-depth way to help you design better experiments.
References
- Kohavi, R., Tang, D., & Xu, Y. (2020). Trustworthy Online Controlled Experiments: A Practical Guide to A/B Testing. Cambridge University Press.
- Hartshorn, S. (2021). Hypothesis Testing: An Intuitive Guide to Making Data-Driven Decisions. Independently published.
- Nassery, L. (2023). Practical A/B Testing: Creating Experimentation-Driven Products. Pragmatic Bookshelf.